

Last Updated on October 18, 2021 by Rakesh Gupta
You can share report by many ways with your colleague or sales team of your organization, like Subscribe a report, Schedule a report or give them report folder access. Salesforce has a very cool feature called as Report Charts. By using it you can share report with your peers, colleague or sales reps in record detail page. Using this you can save time, they get the data they need right on their most-visited pages, without having to go to the Reports tab.
You can embed a Report with Chart to Lightning home pages, record pages, and app home pages to provide interactive visualizations of your data using Report Chart component.
Business Use Case
Pamela Kline is working as a System administrator at Universal Containers. She has create a report to show Open Opportunities group by Opportunity Stage. She would like to learn how to put the newly created report on Lightning Record Page for Account.
Guided Practice (We-do):
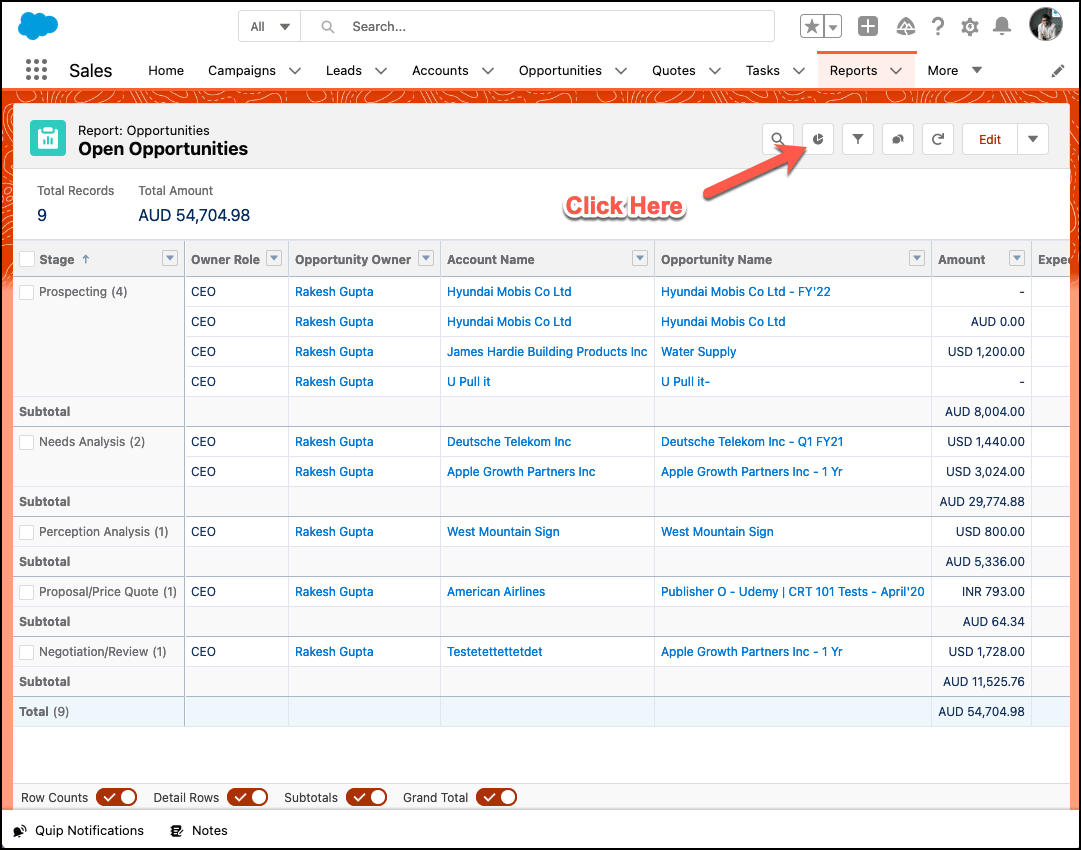
- Click on Report tab and select report that you want to use in Report Charts.
- Make sure that it is Summary or Matrix report.
- Then click on the Add Chart button.

- From the Chart option, select the Chart to display and set the Chart Attributes

- One you’re done, click Save.
- Navigate to Setup | Object Manager | Account | Lightning Record Pages and Edit the right page.
- Drag and drop the Report Charts standard component into place where you would like to add the chart.
- From the Report drop-down list, choose a Report to embed.
- Filter by: Account ID
- Optionally, specify a maximum height and choose to show or hide the dashboard if an error prevents it from loading.

- Click Save.
- Click Activate.


Proof of Concept

Remember
- Share report folder with users, so they can see report chart on detail page layout.
- Reports in personal report folders are unavailable to add to a page.
- Source report has a chart.
Formative Assessment:
I want to hear from you!
What did you learn from this post, is it relevant to you, and how will you modify the concepts taught in the post for your own business processes?
Make a post and tag me on Twitter @automationchamp using #AutomationChampionFlow.


How to place a report not a report chart..
Thanks and nicely done. But how can I set the filter to only show this chart if there is f.e. an open opportunity?
Good Post Rakesh!. Keep up the good work
Thanks Deepshikha